PCR or the Polymerase Chain Reaction has become the cornerstone of modern molecular biology the world over. Real-time PCR is a novel application of the Polymerase Chain Reaction that maximizes the potential of the technique.
To understand Real Time PCR it’s easier to begin with the principles of a basic PCR
Principles of PCR
PCR is a technique for amplifying DNA. There are 2 reasons why you may want to amplify DNA. Firstly you may want to simply create multiple copies of a rare piece of DNA. For example a forensic scientist may want to amplify a tiny piece of DNA from a crime scene. More commonly however you may wish to compare 2 different samples of DNA to see which is the more abundant. Because DNA is microscopic you cannot see which sample contains the most DNA. However, if you amplify both samples at the same rate, you can calculate which sample contained the higher starting copy number. With standard PCR this is done after all amplification cycles have been completed (end point analysis). This can be done by visualizing the PCR product on a gel and measuring the amount of DNA that has been produced
It is a Polymerase enzyme that drives a PCR. A polymerase will synthesize a complementary sequence of bases to any single strand of DNA providing it has a double stranded starting point.
This is very useful because you can select which target gene you wish the polymerase to amplify in a mixed DNA sample by adding small pieces of DNA complimentary to that target gene. These small pieces of DNA are known as primers because they prime the DNA sample ready for the polymerase to bind and begin copying the gene of interest.
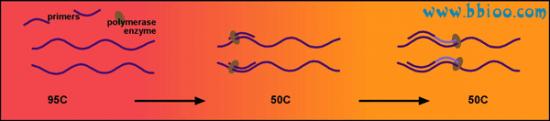
During a PCR, changes in temperature are used to control the activity of the polymerase and the binding of primers to the target gene
To begin, the reaction the temperature is raised to 95℃. At this temperature all double stranded DNA is “melted” in to single strands:
The temperature is then lowered to ~55℃. This allows the primers to bind to your gene of interest. Thus the polymerase has somewhere to bind and can begin copying the DNA strand:
The optimal temperature for the polymerase to operate is 72℃, so at third temperature is used to achieve maximum enzyme activity. Since primers are directed to both single strands of DNA, each PCR cycle will result in a doubling in copy number of the target sequence.
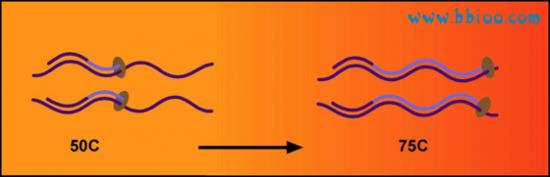
The cycle of changing temperatures (95℃, 50℃ and 72℃) is then repeated and two copies become four. Another cycle and four become eight, and so on... for 40-50 cycles.
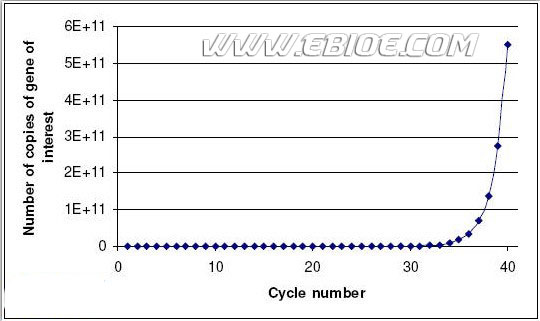
After amplifying your gene in to many millions of copies it is possible to run the amplified DNA out on a polyacrilamide gel and stain it with a dye which makes is visible.
The bigger the visible band, the more copies of your gene you have created.Hence if you are comparing 2 samples e.g. one from a healthy patient and one from a cancer patient, you can see in which sample your gene of interest was expressed most highly.
Real-Time PCR
Real-Time PCR is identical to a standard PCR except that the progress of the reaction in monitored by a camera during each PCR cycle or detector in “real-time”. There are a number of techniques that are used to allow the progress of a PCR to be monitored in this way. Each technique uses some kind of fluorescent marker which binds to the DNA. Hence as the number of gene copies increases during the reaction so the fluorescence increases. This is advantageous because the efficiency and rate of the reaction can be seen. There is also no need to run the PCR product out on a gel after the reaction.
Methods of monitoring DNA amplification in “real-time”:
Fluorescent dyes
Intercalating fluorescent dyes (e.g. SYBR green) are the simplest and cheapest way to monitor a PCR in real-time. These dyes fluoresce only when bound to double-stranded DNA. So as the number of copies of DNA increases during the reaction so the fluorescence increases. The major disadvantage of using a dye such as this is the lack of specificity. This dye will report, not on the amplification of the target sequences, but also any ‘miss-primed’ DNA, that may have been amplified by accident.
Fluorescent probes
Fluorescent probes are pieces of DNA complimentary to your gene of interest that are labeled with a fluorescent dye.
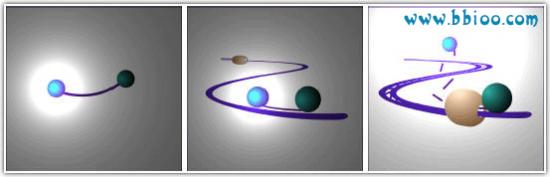
The simplest and most commonly used type of probe is the Taqman-type probe. These probes are labeled with a fluorescent reporter molecule at one end and a quencher molecule (capable of quenching the fluorescence of the reporter) at the other. Hence under normal circumstances the fluorescent emission from the probe is low. However
during the PCR the probe binds to the gene of interest and becomes cleaved by the polymerase. Hence the reporter and quencher are physically separated and the fluorescence increases.
Another commonly used type of probe is the “molecular beacon”. Again these are small pieces of DNA complimentary to your gene of interest labeled with a fluorescent reporter and a quencher molecule on opposite ends. These probes are designed to fold on to themselves to bring the reporter and quencher in to closer proximity and minimize fluorescent emission. However, when the probe binds to the gene of interest the probe takes up a linear confirmation and the reporter and quencher are separated.
This results in the desired increase in fluorescence. Molecular beacon probes are not cleaved by the polymerase but are simply “knocked off” again.
The output from a real-time PCR reaction is in the form of a graph showing the number of PCR cycles (1 cycle = 90℃, 50℃, 72℃) against the increasing fluorescence. This is known as an amplification plot:
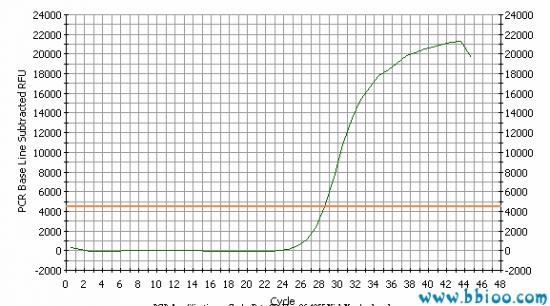
The horizontal line on the graph represents a “threshold” set by the user. The point at which the amplification plot crosses this threshold is known as the Ct (cycle threshold) value. Logic dictates that the lower the Ct value for a sample the greater the starting amount of DNA in the sample. Thus if two amplification plots are compared it is simple to deduce which sample contained the greatest amount of the DNA of interest by the Ct value:
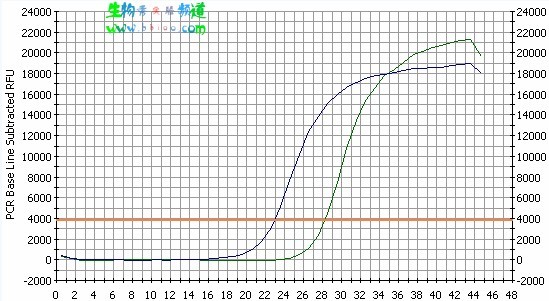
Blue sample Ct value=23. Green sample Ct value=28. Therefore the blue sample contained 32 (25) times more of the gene of interest than the green sample.