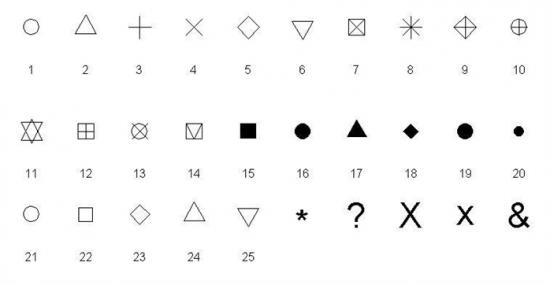
查看pch各参数形状:
plot(rep(1,10),ylim=c(-2,1.2),pch=1:10,cex=3,axes=F,xlab="",ylab="")
text(rep(0.6,10),as.character(1:10))
points(rep(0,10),pch=11:20,cex=3)
text(rep(-0.4,10),as.character(11:20))
points(rep(-0.8,5),pch=21:25,cex=3)
text(rep(-1.2,5),as.character(21:25))
points(6:10, rep(-0.8,5),pch=c("*","?","X","x","&"),cex=3)
text(6:10,rep(-1.2,5),c("*","?","X","x","&"))
参考资料:台北大学林建甫 C.F. Jeff Lin, PhD. R语言课件及代码