近期国际学术期刊《Stem Cells》发表了以裴钢研究组为主完成的最新研究成果:小分子化合物通过E-cadherin 蛋白加速重编程过程。
细胞重编程是指已经分化的细胞重新获得分化多能性的过程。诱导多能干细胞即iPS细胞是通过向体细胞中以病毒方式导入外源的四个转录因子Oct3/4,Sox2,c-Myc及Klf4而获得,具有与胚胎干细胞(ESC)相似的形态和表观遗传特征,更重要的是,二者具有相似的分化能力,即分化的全能性。iPS细胞的出现使得无伦理争议的病人特异性的干细胞获得成为可能,而由病人特异性的iPS细胞分化得到的特异性前体细胞和成熟细胞即可应用在组织器官移植治疗、基因治疗、药物筛选模型的建立、以及特异疾病分子机制的研究等多方面。了解重编程过程复杂的分子机制有利于开发更加安全和有效的iPS诱导方法。
在已有的iPS细胞诱导体系的基础上,裴钢等研究组此项研究工作发现细胞粘附相关分子E-cadherin蛋白在iPS形成过程中起着重要作用。E-cadherin蛋白的表达水平在细胞重编程过程的早期即开始上调;在完全重编程的iPS细胞中存在着与ES细胞中相同的由E-cadherin蛋白介导的细胞-细胞连接,下调E-cadherin的表达会降低iPS形成效率,反之,过表达E-cadherin能够促进iPS形成效率。在重编程过程中过表达E-cadherin而得到的iPS细胞具有和ES细胞一样的分化全能性。进一步,研究人员筛选得到了两种能够通过促进E-cadherin蛋白表达而提高iPS细胞诱导效率的小分子化合物,从而提供了优化iPS细胞诱导效率的新策略。
该项工作得到了国家科技部、国家自然科学基金委及中国科学院经费支持。(生化与细胞所)
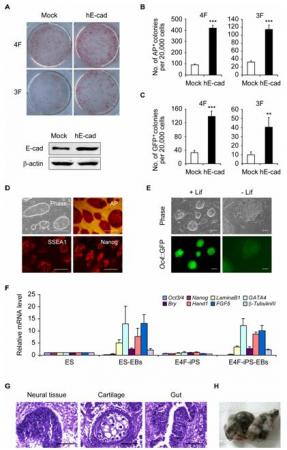
Figure 1. Ectopic expression of E-cadherin enhances reprogramming efficiency.
(A) Representative images of AP+ colonies. MEF cells were transduced with retrovirus containing four factors (Oct3/4, Sox2, Klf4 and c-Myc) plus E-cadherin or three factors (Oct3/4, Sox2 and Klf4) plus E-cadherin and cultured in the standard iPS induction conditions. Cultures were fixed and stained for alkaline phosphotase activity (Upper panel). Parallel-transduced MEF cells were tested for E-cadherin over expression by western blot using antibody specific for E-cadherin (Lower panel). 4F, four factors; 3F, three factors.
(B) Quantification of AP+ colony numbers after E-cadherin overexpression. Bars represent numbers that normalized as relative colony numbers per 20,000 starting cells. The error bars denote the standard error derived from quantification of three independent experiments.
(C) Quantification of Oct4::GFP positive (GFP+) colony numbers after E-cadherin over expression. As a more stringent quantification for reprogramming efficiency, GFP+ colonies numbers were counted under a fluorescence microscope. Bars represent numbers that normalized as relative colony numbers per 20,000 starting cells. The error bars denote the standard error derived from quantification of three independent experiments.
(D) Morphology of iPS cells derived by the four factors plus E-cadherin method (E4F-iPS cells). Phase contrast photo shows an ES-like morphology of E4F-iPS cells. Antibody staining shows that E4F-iPS cells express pluripotency markers SSEA1 and Nanog. Represent pictures of iPS cell line E4F-iPS-1 are shown. The scale bars represent 100 mM.
(E) Morphology of E4F-iPS cells maintained in medium with and without LIF. E4F-iPS cells were passaged on MEF feeder cells and maintained in + LIF medium or – LIF medium for 3days. Morphology (phase) and Oct4::GFP expression (Oct4::GFP) were scanned and photographed. The scale bars represent 100 mM.
(F) Real-time PCR analysis of the markers for pluripotency and all three germ layers in embryoid bodies derived from E4F-iPS cells. Results from cell line E4F-iPS-1 are shown. Bars represent expression levels relative to that of ES cells. b-actin was used as an internal control.
(G) Teratomas derived from E4F-iPS cells. Shown are representatives HE staining pictures for ectoderm (neural tissue), mesoderm (cartilage) and endoderm (gut). Scale Bars represent 50 mM.
(H) Two-week-old chimeric mice derived from E4F-iPS cells.

Figure 2. Chemicals that upregulate E-cadherin can enhance reprogramming efficiency.
(A) Immunoblotting of E-cadherin expression in 4-factor transduced MEF cells under small-molecule treatment, with the concentrations listed. Equal volume of DMSO was used as control. Quantification by densitometric analysis is shown.
(B) Schematic representation of iPS cell generation with chemical treatment.
(C) Quantification of the efficiency of 4-factor induced iPS cell generation with small-molecule treatment. The error bars denote the standard error derived from quantification of three separate wells of cells.
(D) Fold change in the E-cadherin protein level under chemical treatment. The error bars denote the standard error derived from densitometric analysis of three independent experiments.
(E) Quantification of the efficiency of 4-factor induced iPS cell generation under Apegenin (5, 10 and 15 μM) treatment.
(F) Fold change in the E-cadherin protein level under Apigenin (5, 10 and 15 μM) treatment. The error bars denote the standard error derived from densitometric analysis of three independent experiments.